Paris Viz
A living atlas of Paris and Île-de-France, drawn from open data.
Mouvementthe city in motion
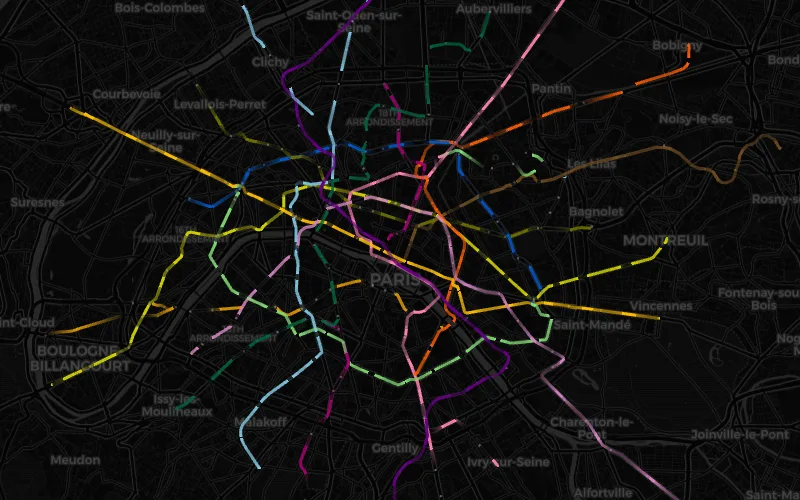
Flux - the transit network in motion
Every scheduled trip of a full day moves across the map: 20,000 métro, RER and tram runs, plus 90,000 buses one checkbox away.
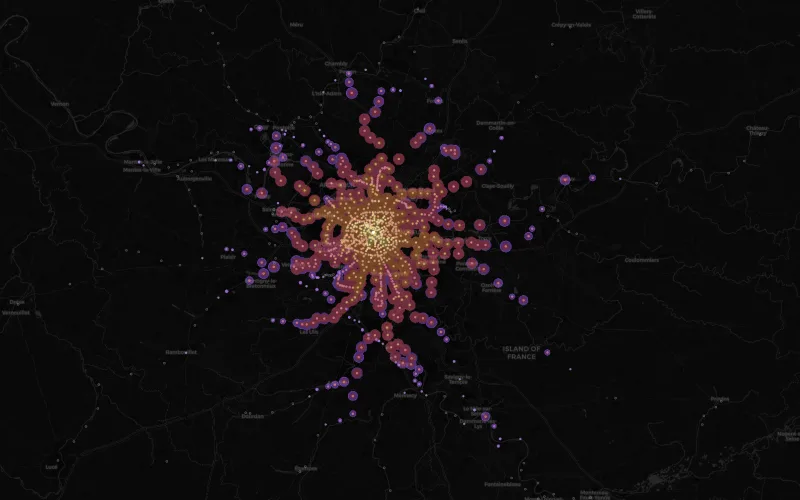
Horizon - how far can you get?
Pick any station and watch 75 minutes ripple across the region: everywhere the rail network can take you, walking included.
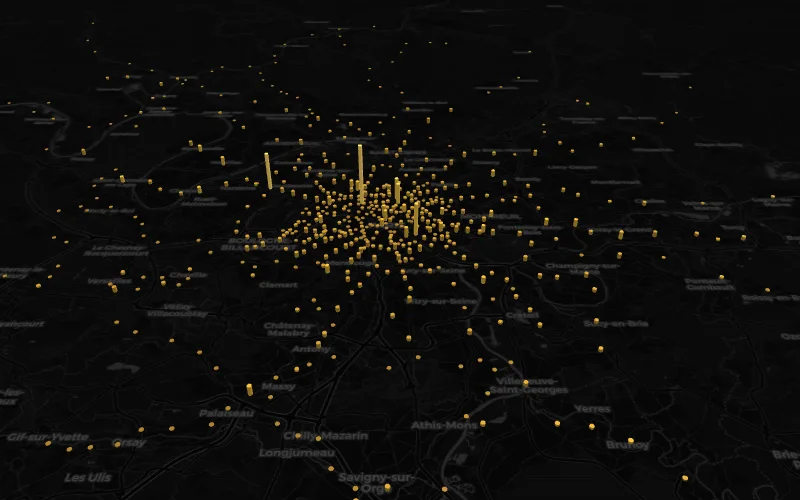
Relief - the ridership landscape
Every station as a mountain rising with its validations per hour: a calm sea at 3am, ranges along the RER at 8:30, La Défense towering alone at 6pm.
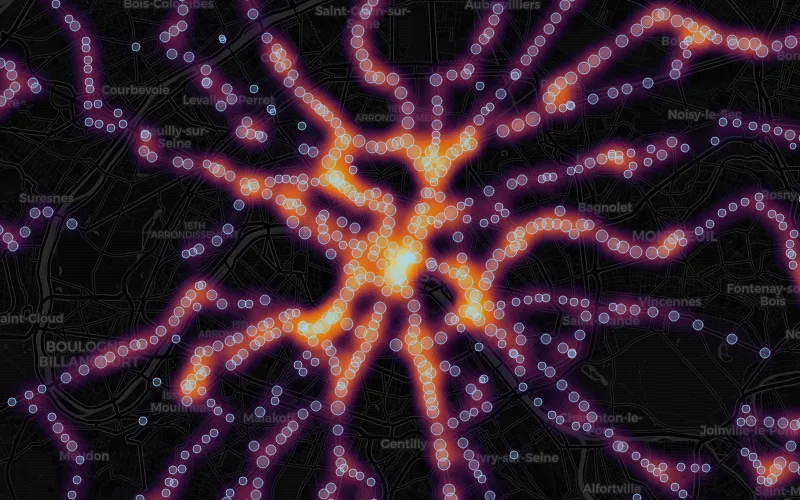
Noctilien - night buses
Heatmap of night-bus frequency: which neighbourhoods are served after midnight, and which are not.
Matièrethe built city
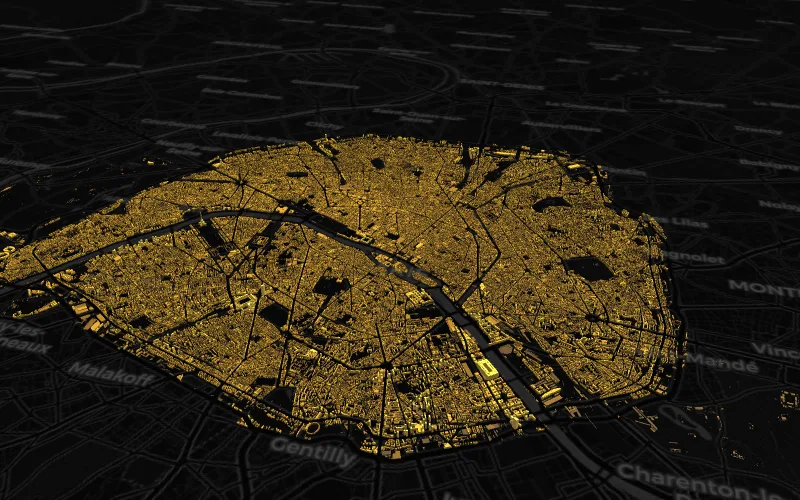
Vertige - how tall is Paris?
Every building inside the périphérique in 3D, appearing floor by floor: the whole city tops out at the Haussmann roofline, then a handful of towers keep climbing alone.
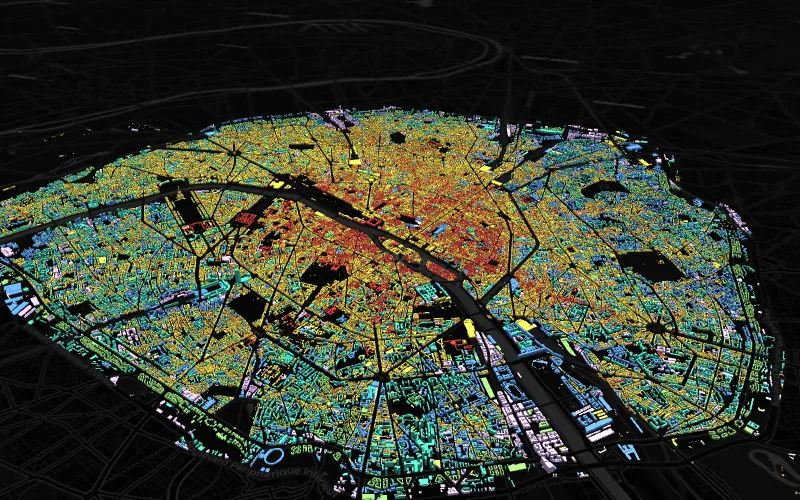
Strates - how old is Paris?
The same city assembled year by year: the medieval core, the 1851-1914 explosion that built half of Paris, then the concrete century filling the edges.
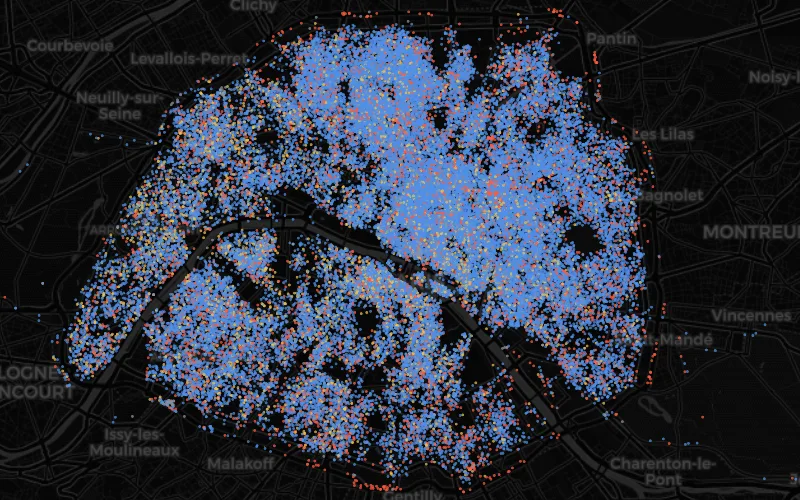
Mirage - the tourist flats
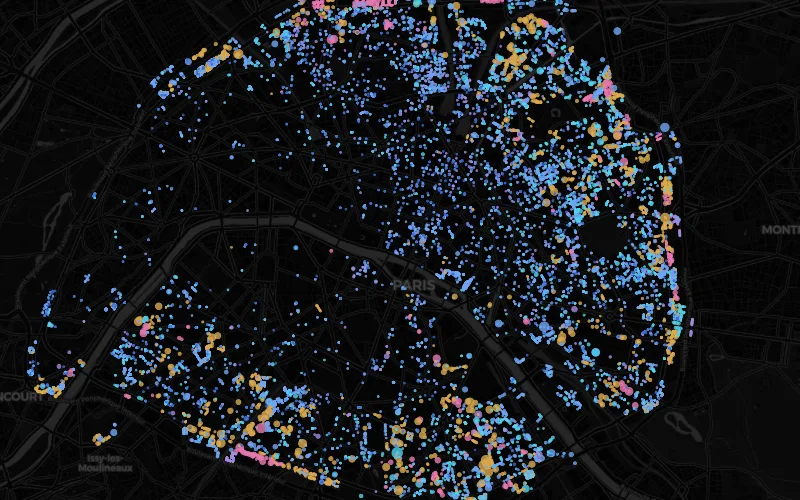
Every Airbnb in Paris colored by registration status: watch today's 78,000 listings arrive year by year, half of them since mid-2023.
Élémentsair, heat and water
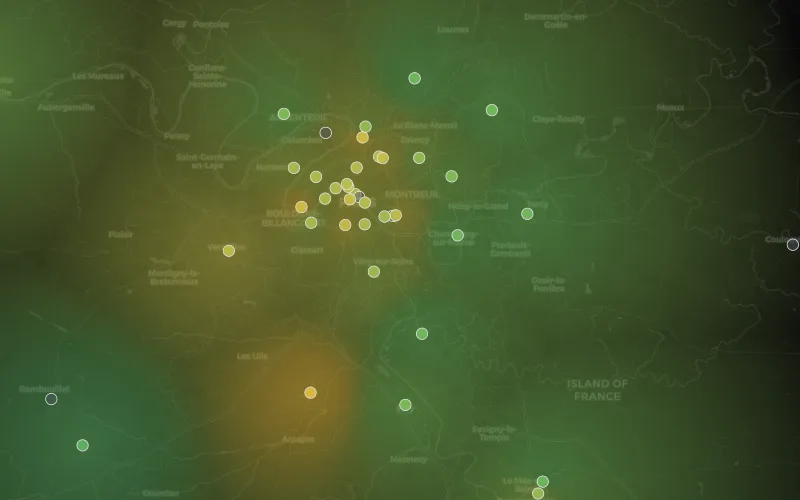
Respire - the air you breathe
Seven years of hourly air quality breathing over the map: winter smog, clean windy days, and the 2020 lockdown clearing the sky in a week.
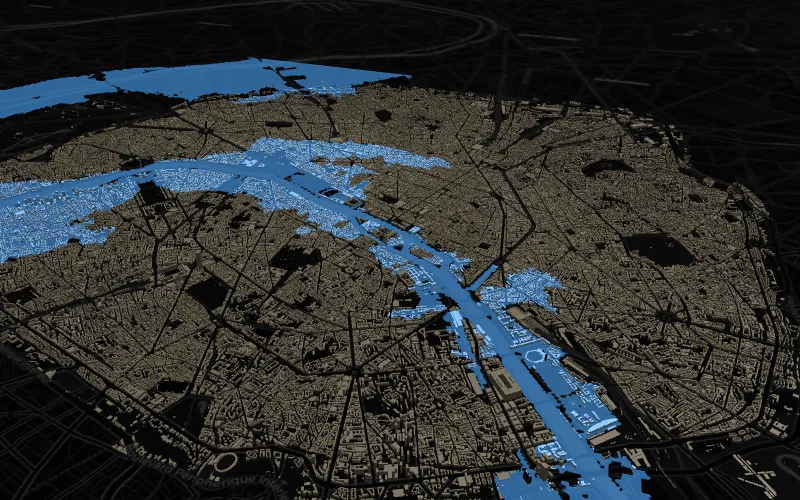
Crue - the Seine rising
Raise the river through the 3D city, centimeter by centimeter over the real terrain: the quays go under at 6 m, and at 8.62 m the flood of 1910 returns.
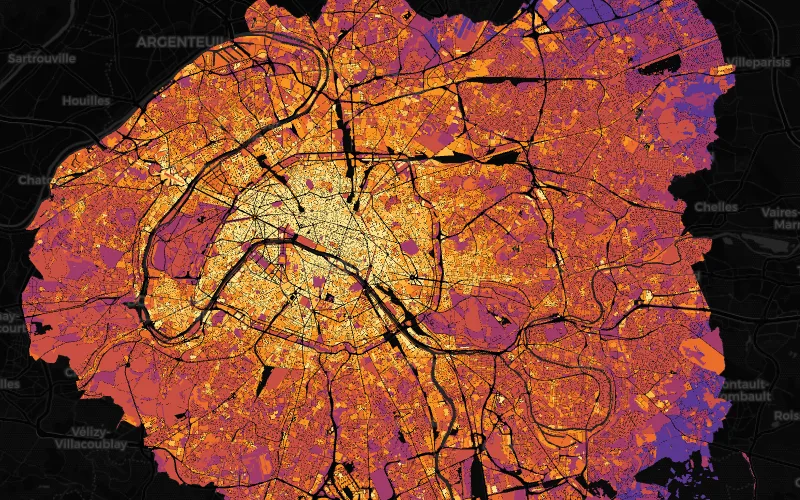
Canicule - the heat island
39,000 blocks scored for heat: the dense mineral city glows long after dark while parks and rivers stay cool, and the night map shows who cannot escape it.
Sociétéwho lives where
About the data
Every map on this site is built from open data and precomputed into a static file: no backend, no cookies, and each page shows the exact period its data covers.