About the data
Everything on this site is built from open data: scheduled timetables (GTFS) and ticket validation counts published by Île-de-France Mobilités, hourly air quality measurements from Airparif, building heights and terrain from IGN databases (BD TOPO, RGE ALTI), construction periods from the Apur building footprints, heat-island scores from the Institut Paris Region, short-term rental listings from Inside Airbnb, the national register of social housing (RPLS), and the national address base for geocoding. No cookies and no backend, only anonymous aggregate page counts: each visualization is precomputed into a static file, and each page shows the exact period its data covers.
Data is regenerated automatically twice a month, since published timetables only cover about 30 days ahead.
The whole site is open source: github.com/lematty/paris-viz
data.iledefrance-mobilites.fr · IDFM GTFS · airparif.fr · IGN BD TOPO · opendata.apur.org · Institut Paris Region · adresse.data.gouv.fr · insideairbnb.com · RPLS
Map by map
Flux - the transit network in motion
Every scheduled trip of the Île-de-France network over one full day, replayed on the map: métro, RER and Transilien, tram, and optionally the roughly 90,000 daily bus runs. Each dot is one vehicle moving along its real route between its scheduled stops.
The data is the public GTFS timetable published by Île-de-France Mobilités, cut into three representative days: a school-period weekday, a Saturday and a Sunday. It is the theoretical schedule, so no delays, no disruptions, no crowding, and positions between stops are interpolated along the line's path.
Horizon - how far can you get?
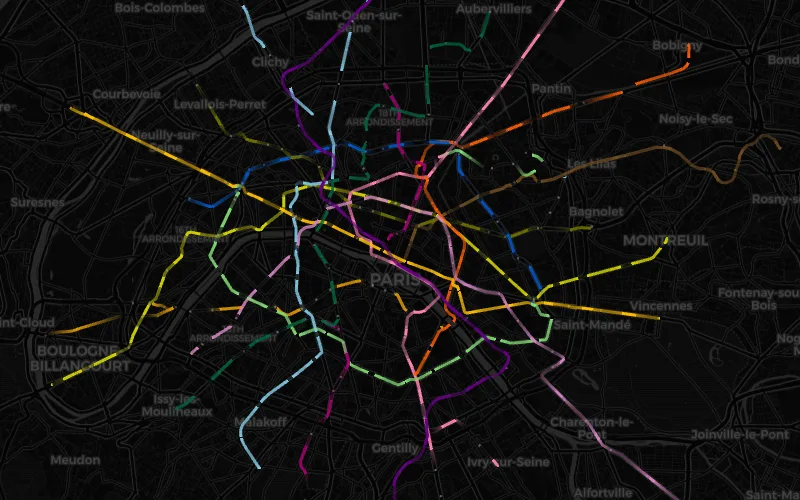
Pick a station and the map shows how far the rail network can carry you: each color band is minutes of travel by métro, RER and Transilien or tram, with the final walk away from the arrival station included.
Travel times come from a station-to-station matrix computed from the Île-de-France Mobilités timetable for a typical weekday. The routing is frequency-based rather than tied to one departure: riding time is the median scheduled run, boarding a line costs half its daytime headway, and transfers use the published walking times. The result reads as average conditions, not a race with one specific train.
Relief - the ridership landscape
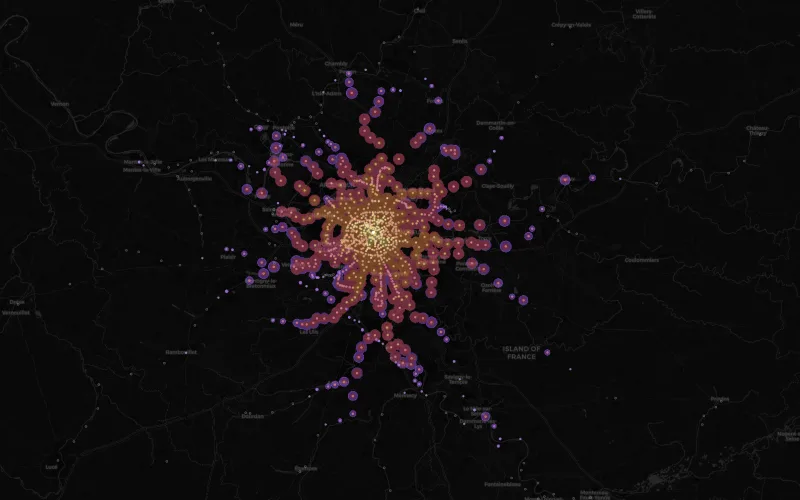
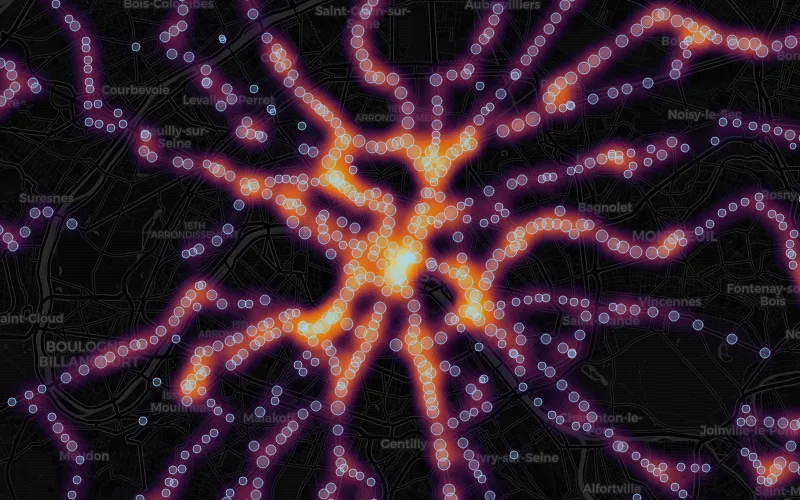
Every rail station of Île-de-France rises with its ticket validations per hour: a flat sea at 3am, mountain ranges along the RER lines at 8:30, La Défense towering alone at 6pm.
Counts come from the Île-de-France Mobilités open-data validation datasets: daily totals per station joined to hourly profiles per day type (weekday, Saturday, Sunday, outside school holidays), averaged over the covered quarter so each station's curve reads as a typical day. Validations count entries only: exits and connections inside the network are invisible.
Noctilien - night buses
How often a Noctilien night bus passes near every point of Île-de-France between roughly 00:30 and 05:30, split into weeknights and Friday-Saturday nights: bright means frequent service, dark means long waits or no coverage at all.
Frequencies are counted per stop from the scheduled Île-de-France Mobilités timetable over the feed's validity window, and the address search is geocoded through the national address base. As everywhere on this site, it is the theoretical schedule, not live traffic.
Data: IDFM GTFS (transport.data.gouv.fr) · Base Adresse Nationale
Vertige - how tall is Paris?
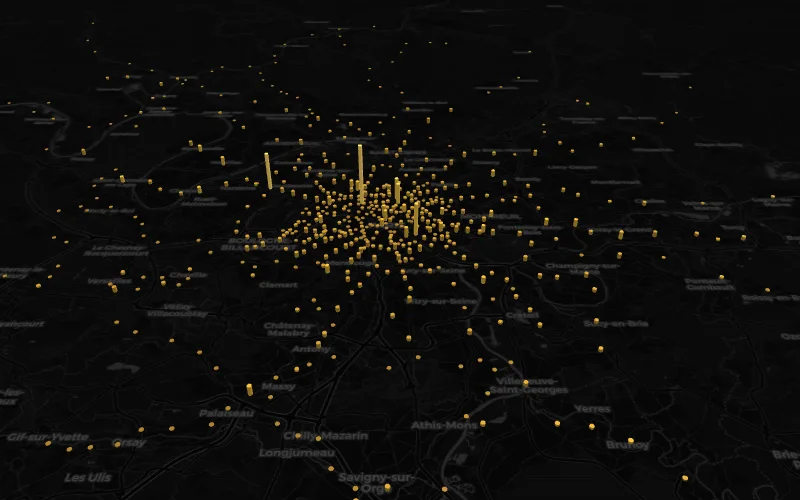
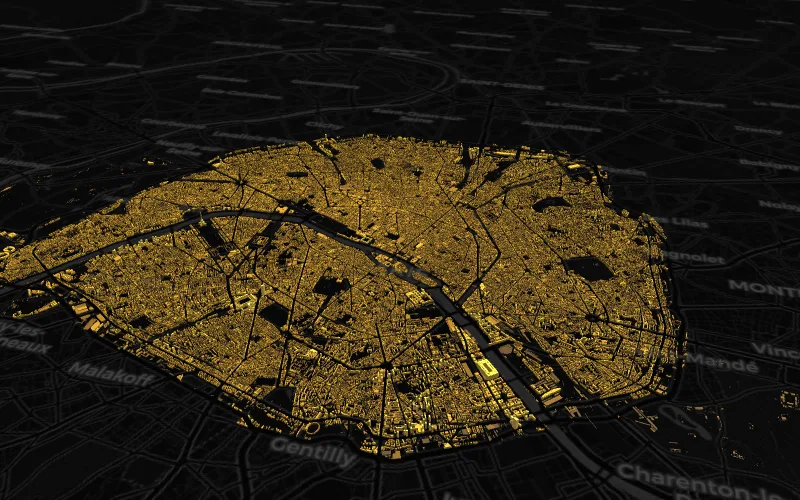
Every building of Paris intra-muros in 3D with its measured height, appearing floor by floor: almost the whole city stops at the Haussmann roofline, then a handful of towers keep climbing alone.
Footprints and heights come from IGN BD TOPO, the national topographic database. Heights are photogrammetric measurements (roof gutter above the ground), not estimates from floor counts, and buildings are clipped to the 20 arrondissements using the city's open contours.
Data: IGN BD TOPO · opendata.paris.fr
Strates - how old is Paris?
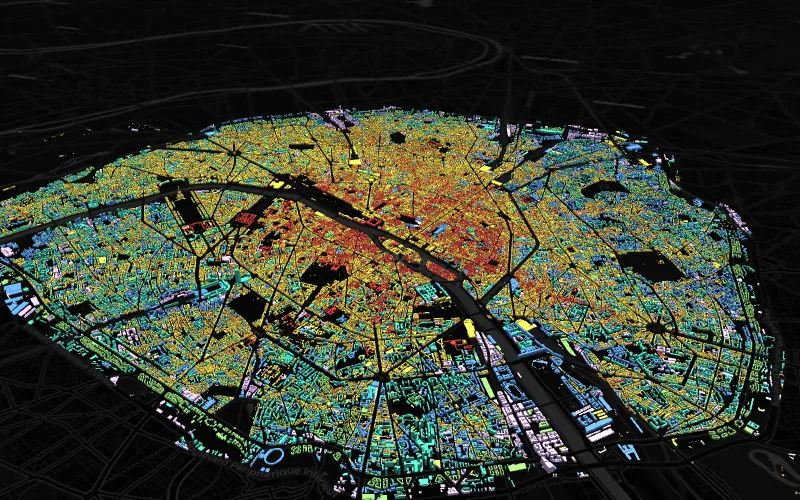
Every built footprint of Paris colored by construction period and assembled year by year: the medieval core, the 1851-1914 explosion that built half of the city, then the concrete century filling the edges.
Footprints and dating come from the Apur's 'emprise bâtie décomposée' layer (ODbL). The dating mixes the Loyer survey for pre-1940 facades, fiscal files, building permits and field surveys; about 6% of footprints could not be dated and are shown as undated bedrock. Heights are the Apur's photogrammetric median heights.
Data: Apur (ODbL)
Mirage - the tourist flats
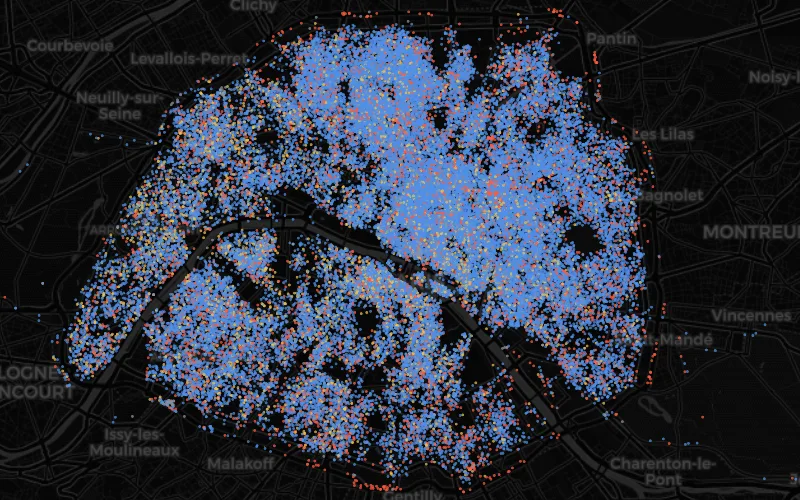
Every Airbnb listing of Paris intra-muros, arriving on the map year by year (a listing appears at its first guest review) and colored by its registration status with the city.
Listings come from the Inside Airbnb scrape (CC BY 4.0). Paris requires most short-term rentals to display a 13-character registration number; the status is read from the listing's license field as typed by the host: a well-formed number counts as declared, mobility leases and hotel-type listings are exempt, anything else counts as unregistered. Review dates only approximate a listing's active life.
Respire - the air you breathe
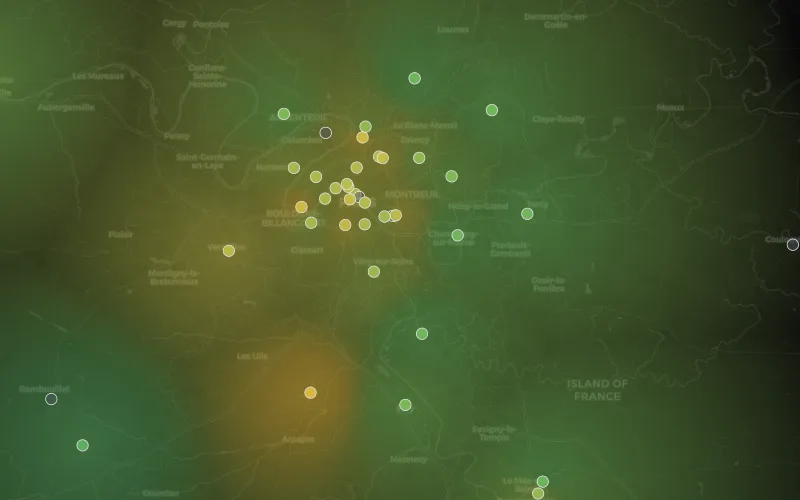
Seven years of hourly air quality breathing over the Paris region: NO₂ from traffic and PM₂.₅ fine particles, winter smog episodes, clean windy days, and the 2020 lockdown clearing the sky in a week.
Measurements are the hourly station data published by Airparif, the region's air quality observatory. The colored veil interpolates between monitoring stations (inverse-distance weighting) and fades where no station is nearby, so fine local variations between stations are smoothed away.
Data: Airparif open data
Crue - the Seine rising
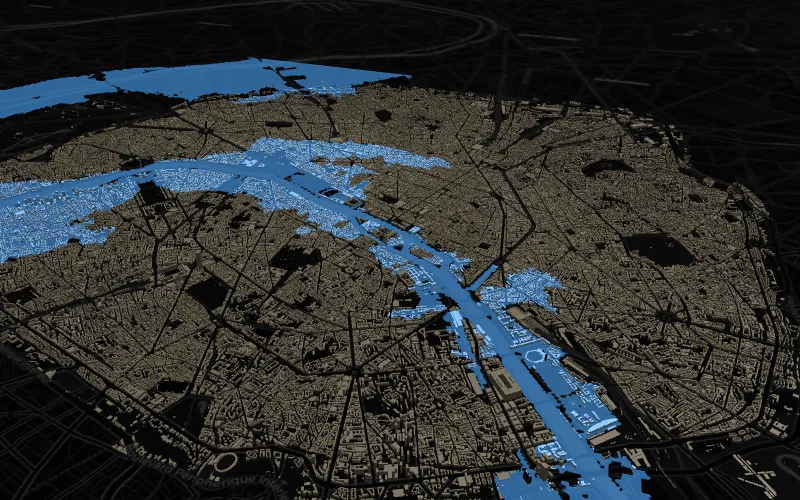
Raise the Seine through the 3D city and watch how far each gauge height spreads over the real terrain. Heights use the Austerlitz gauge scale, where the 1910 flood peaked at 8.62 m, and the page also shows the river's level right now, fetched live from Hub'Eau.
The flood extent is a connectivity-aware fill computed on the IGN RGE ALTI elevation model: a cell floods only when the water can actually reach it from the river, not merely when it lies below the waterline. It is a visualization, not a safety model: the terrain grid smooths parapets and low walls, and protection works and the underground are ignored.
Data: IGN RGE ALTI · Hub'Eau / Vigicrues
Canicule - the heat island
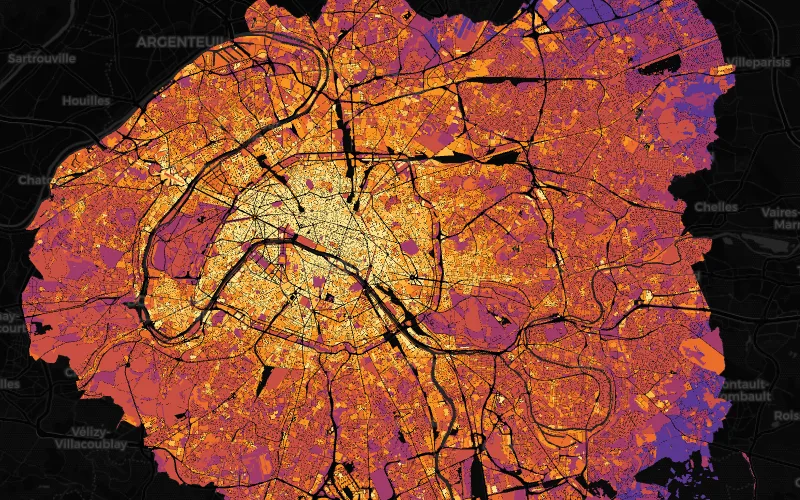
39,000 urban blocks of Paris and the petite couronne scored for heat: which neighbourhoods overheat by day, which never cool down at night, and where the heat meets the most vulnerable residents.
Scores come from the Institut Paris Region's heat-island dataset (Licence Ouverte 2.0): each morphological block carries a local climate zone and day and night scores for heat hazard and vulnerability, derived from land cover, built density and population. The map is clipped to Paris and the three petite couronne departments.
Data: Institut Paris Region
Logis - where social housing is
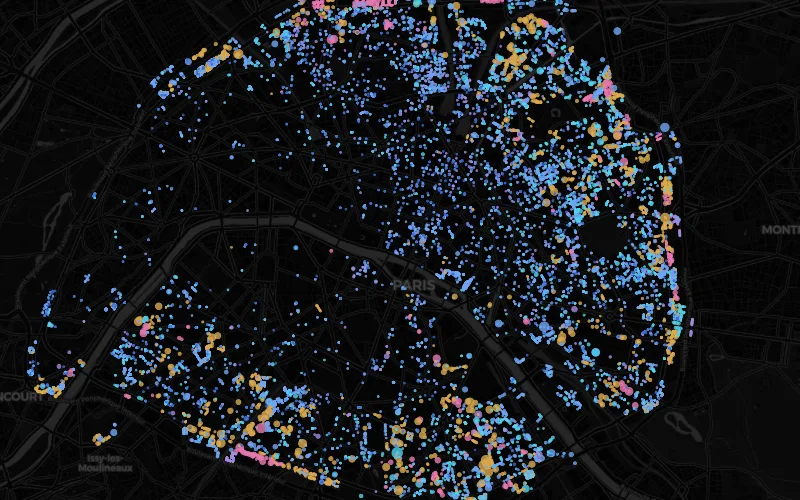
Every address of the Paris social-housing stock as a dot sized by its dwellings and colored by financing category, from the HBM belt of the 1920s-30s to today's PLAI. The years sweep by first letting as social housing, so each date shows the stock actually in service: a quarter of it entered service more than twenty years after it was built, buildings bought and converted, mostly since 2000.
The data is the RPLS, the national register of social landlords' rental stock (situation on January 1st, 2025), published address by address by the ministry's statistical service under an open license. The open file carries no rent and no landlord identity, and about 1% of dwellings lack coordinates and are left off the map. Financing codes are grouped into six families; 'first let' dates for the oldest buildings are the register's, sometimes reconstructed.